
14 Feb Visualising Symbol node stats
So in my last post “Obtaining total harvesting balances for Symbol nodes” I showed you how we can use the Symbol Python SDK and MongoDB to retrieve the addresses and account balances of all accounts harvesting on all API nodes across the Symbol network. Today I want to take this a step further and produce some visualisations so that we can see what these numbers actually represent. I was going to do this with circle packing plots but it turned out that the packages to make these in Python are really lousy (as I found out after running the code I wrote and an article that went with it). I have done this before in R but I figured that’s a post for another day as it is a bit more involved and my
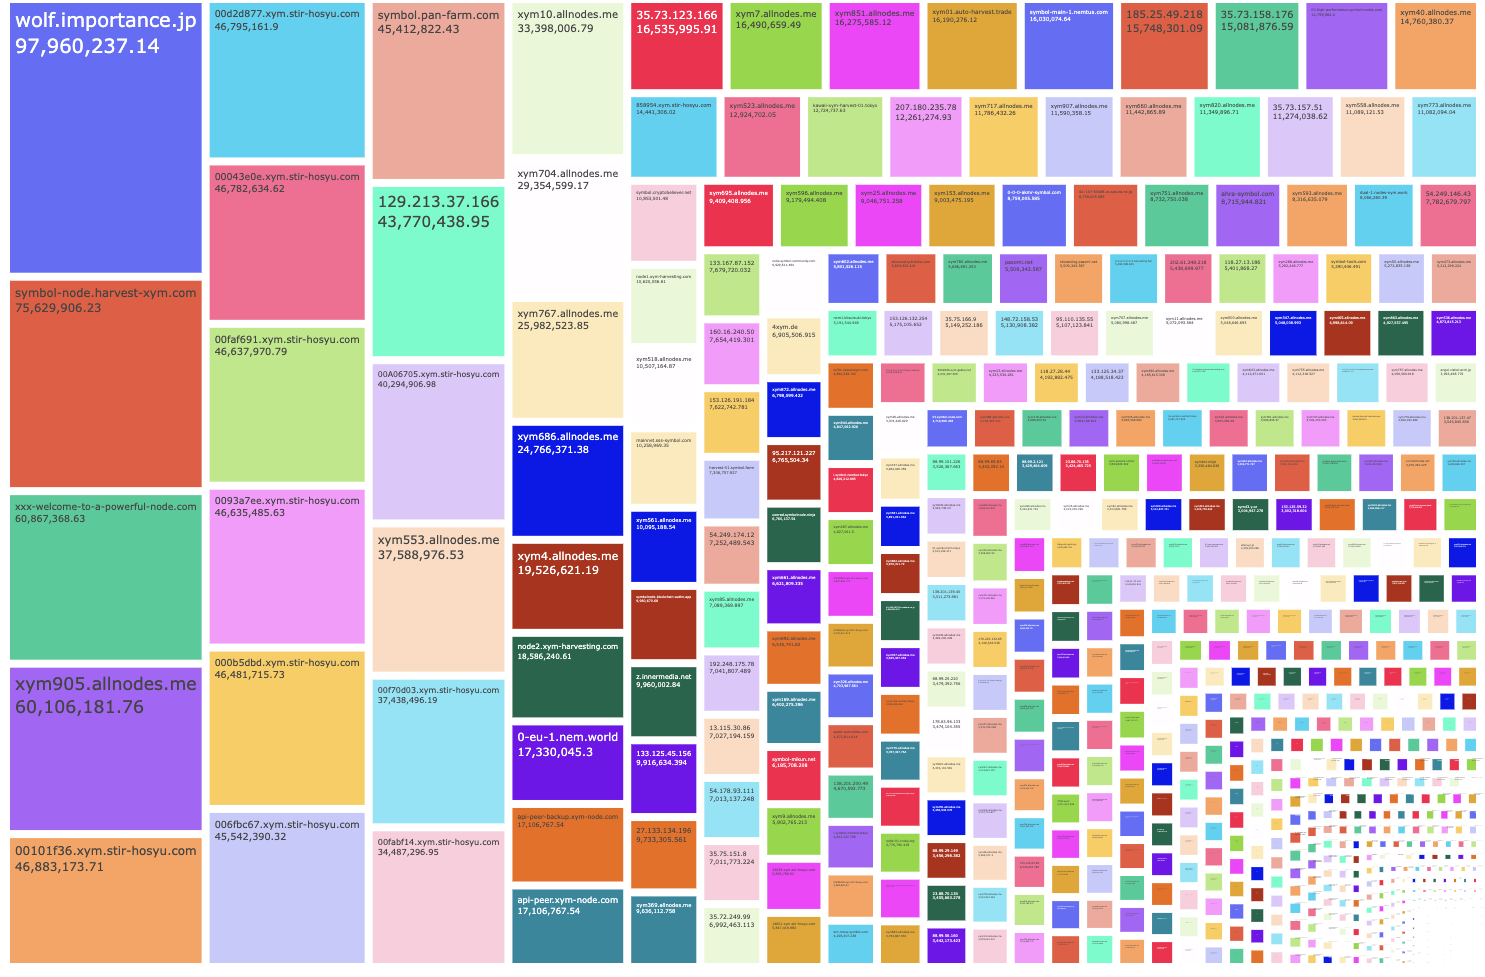
So instead, I have written some simple code that you can add to the end of the last Jupyter notebook to output a treemap showing the relative contribution of each node to the total harvesting power (at least for API nodes). Before you run this you will have to install plotly: pip install plotly
import plotly.graph_objects as go

# First, sum the balances for each node
node_sums = {node: sum(balances) for node, balances in balance_details.items()}

# Prepare data for Plotly
labels = ["Total harvesting balance"] + list(node_sums.keys())
parents = [""] + ["Total harvesting balance"] * len(node_sums)
values = [0] + list(node_sums.values())

# Create the treemap
fig = go.Figure(go.Treemap(
    labels=labels,
    parents=parents,
    values=values,
    textinfo="label+value",
    hoverinfo="label+value+percent parent"
))

fig.update_layout(margin=dict(t=0, l=0, r=0, b=0))

# Save the figure to an HTML file

fig.write_html('node_balance_treemap.html')
And your output should look something like this:
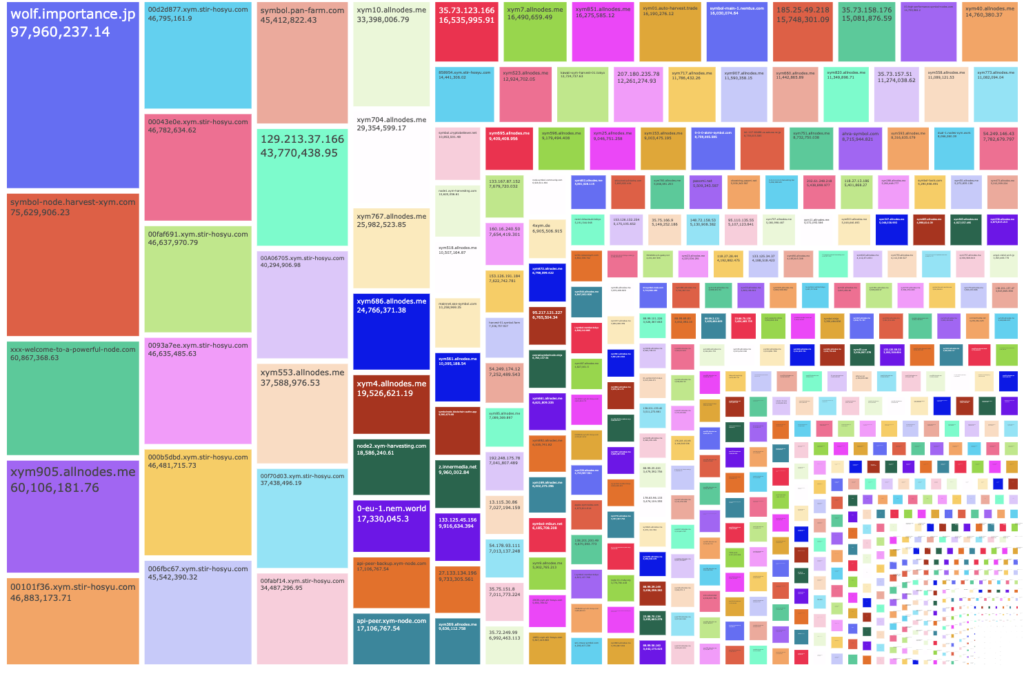
Unfortunately, I can’t embed the interactive HTML file in this post or at least for some reason it is not displayed when I preview the post. You can open it here though
As they say, a picture is worth a thousand words and I think visualising data in this way is much easier than making sense of a list with hundreds of rows. I know that the labels are small but mousing over a node shows detailed information even when the text is too small to read. I found my node and it looks like it represents 0.0904% of the total harvesting balance 😂
EDIT: We can also include the account weighting within each node box:
import plotly.graph_objects as go

# Initialize lists for labels, parents, and values
labels = ["Total"]  # Root label for the treemap
parents = [""]  # The root has no parent
values = [sum(sum(balances) for balances in balance_details.values())]  # Total sum of all balances

# Loop through each node to add it and its accounts to the treemap data
for node, balances in balance_details.items():
    # Ensure the node total is the sum of its accounts
    node_total = sum(balances)
    labels.append(node)
    parents.append("Total")
    values.append(node_total)

    # Add accounts to node
    if node in address_details:
        for i, balance in enumerate(balances):
            # Append account details
            account = address_details[node][i] if i < len(address_details[node]) else f"{node} Account {i}"
            labels.append(account)  # Use a unique identifier for each account
            parents.append(node)
            values.append(balance)

# Create the treemap
fig = go.Figure(go.Treemap(
    labels=labels,
    parents=parents,
    values=values,
    textinfo="label+value",
    hoverinfo="label+value+percent parent",
    branchvalues="total"  # Ensures the visualization uses the sum of child values
))

fig.update_layout(margin=dict(t=0, l=0, r=0, b=0))

fig.write_html('node_account_balance_treemap_detailed.html')
So now clicking a node will show the contributions of accounts to the total harvesting balance – e.g.:
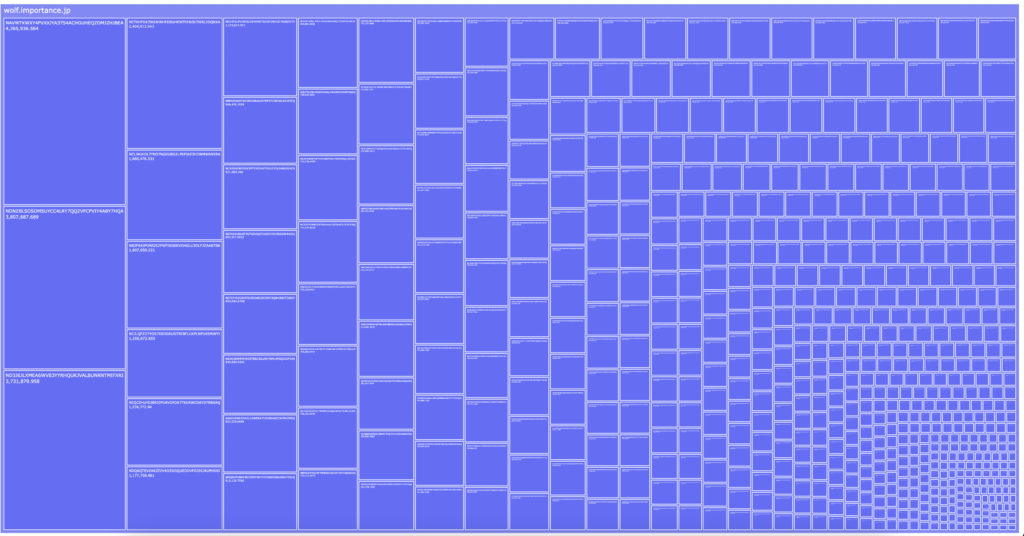
The interactive version is here
I’m a Symbol and NEM enthusiast and run this blog to try to grow awareness of the platform in the English-speaking world. If you have any Symbol news you would like me to report on or you have an article that you would like to publish then please let me know!
No Comments