23 Dec A trip down memory lane for Symbol and NEM
I wanted to generate some stats for my advent calendar article and was going to sum up the year and maybe make a comparison with 2022 but I thought why not go the whole hog and show stats for the entire lifetime of both NEM and Symbol 😅 This may be a short article but believe me it took a while to write all of the code to make the plots! If anyone is interested I may try to clean up and merge the Jupyter Notebooks I used and make the code available after the Christmas break – I have included methods but they may not work out of the box as they are taken from multiple (very messy) notebooks.
Transactions
The total daily transactions plots are by far the easiest to make 😅 Here I have presented total daily transactions for both Symbol and NEM and a comparison of total transactions on both chains since Symbol’s launch. I have then plotted the same for daily unique active addresses (how many people are using the network each day).
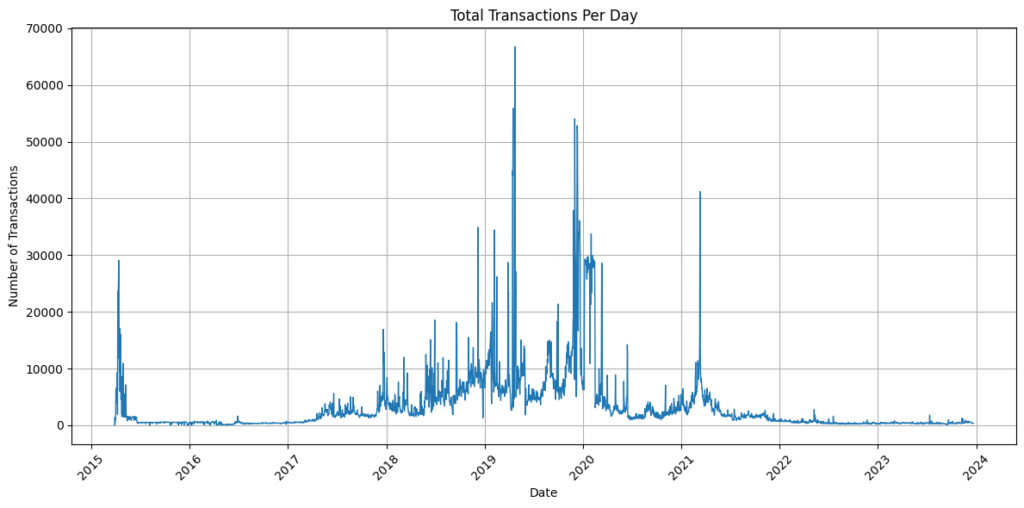
NEM total daily transactions
NEM transactions peaked in 2019 with a significant rise around the time of Symbol’s launch but since then network usage has fallen with just 16,115 transactions being recorded across the entire month of November 2023.
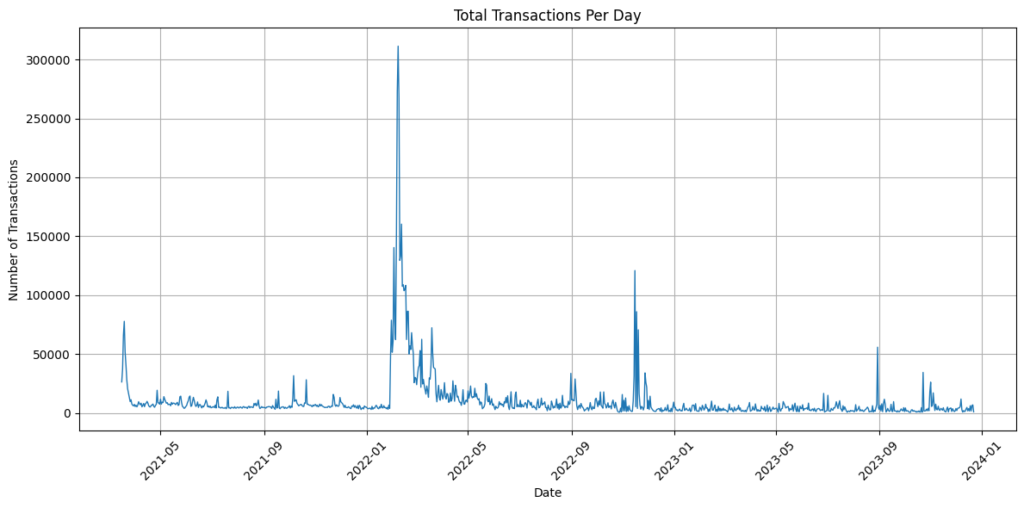
Symbol total daily transactions
Symbol transactions peaked in early 2022, which coincided with the launch of COMSA. Although usage has dropped since its peak, Symbol has averaged over 100,000 transactions per month across 2023.
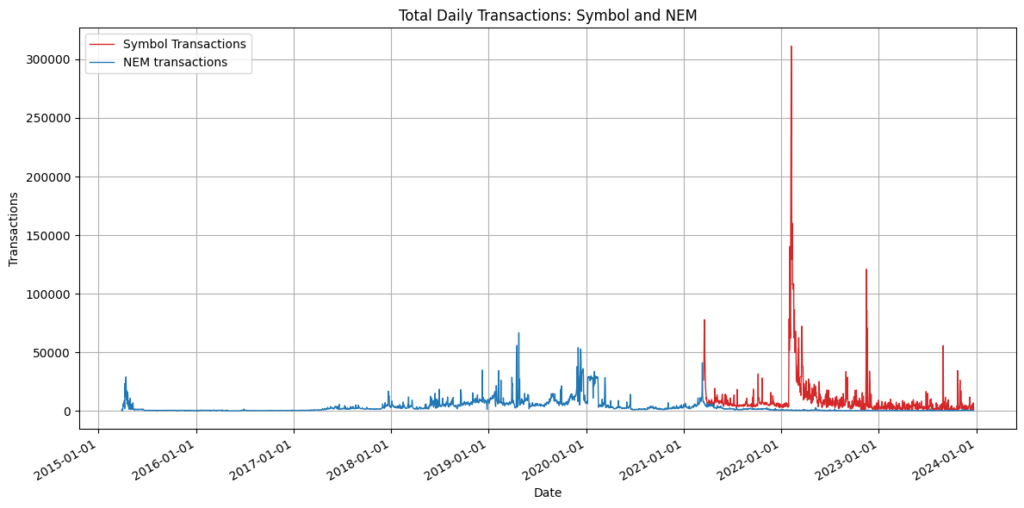
NEM vs Symbol: Total daily transactions
As you can see, since Symbol’s launch, it has been dominant generating more transactions than NEM across its lifetime.
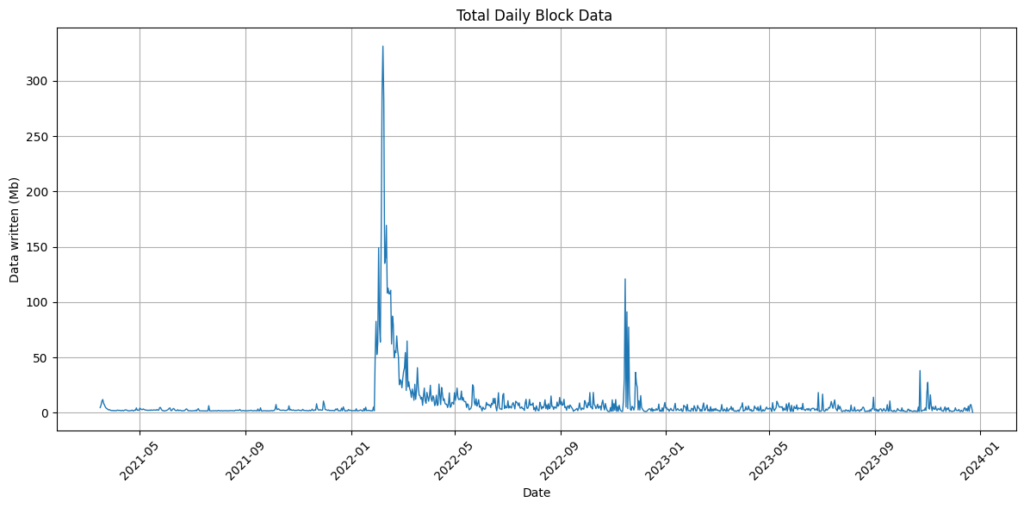
Symbol block data
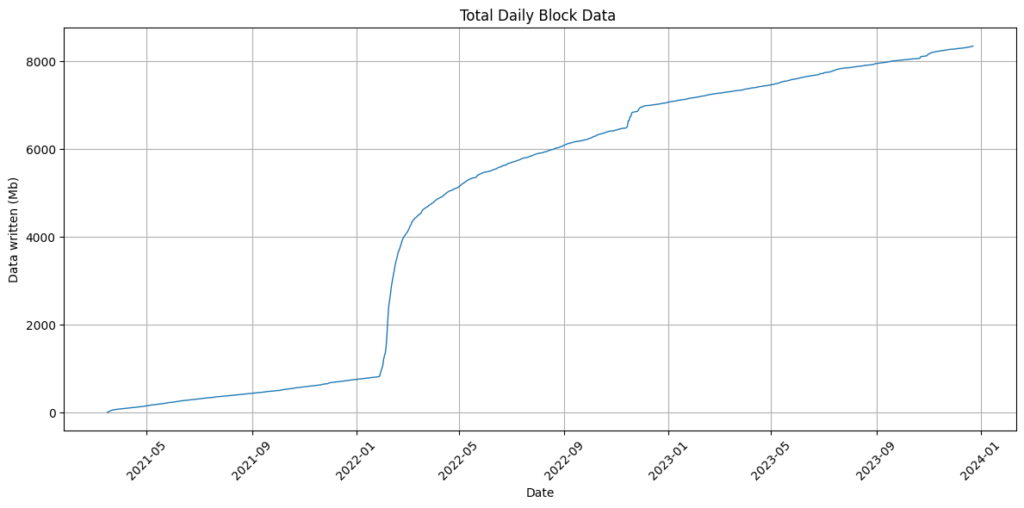
The plot below shows the amount of daily block data written to chain again there is a COMSA spike but after the initial excitement wore off levels have stabilised.
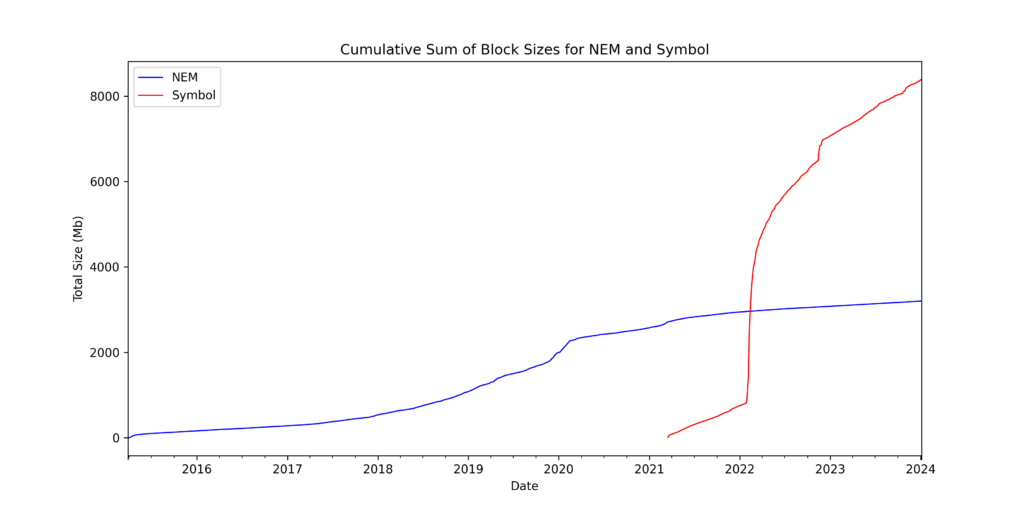
And as a cumulative plot we see that over 8Gb of data has been written to chain. I am not exactly sure how to make this plot for NEM so unfortunately there is no comparison as yet. Edit – Jag has told me how but it seems a bit involved so I will insert the plot once I have worked out how to do it. EDIT: I solved it with Anthony’s help!
NEM block data
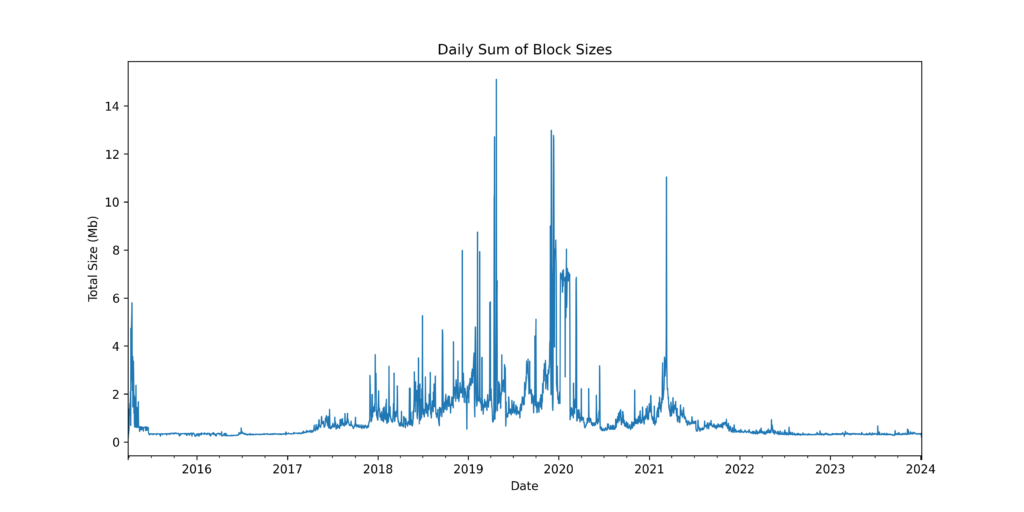
The same plot for NEM shows that data written to chain has fallen since Symbol’s launch.
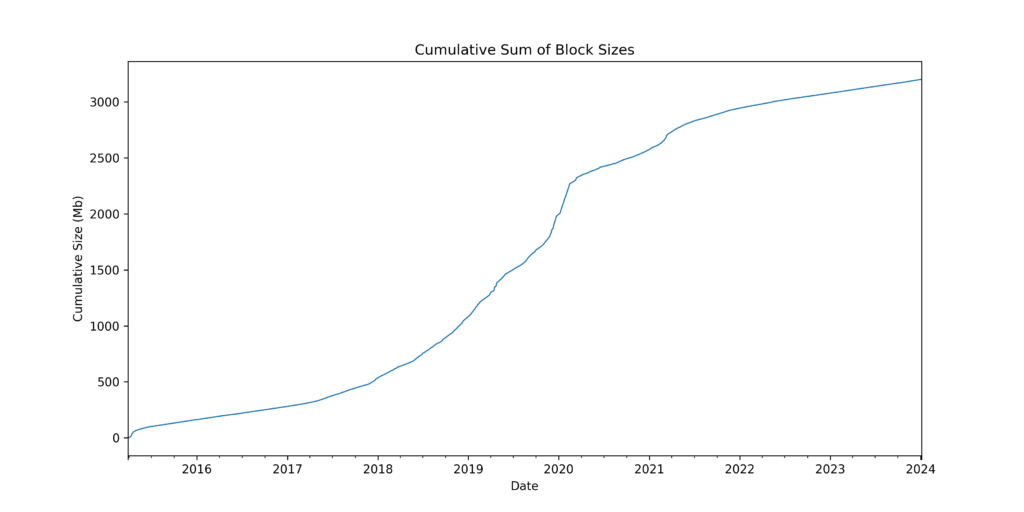
Despite it’s age, only around 3Gb of data has been written to the NEM chain.
NEM vs Symbol: Block data
As a comparison, we can see that far more data is being written to the Symbol chain.
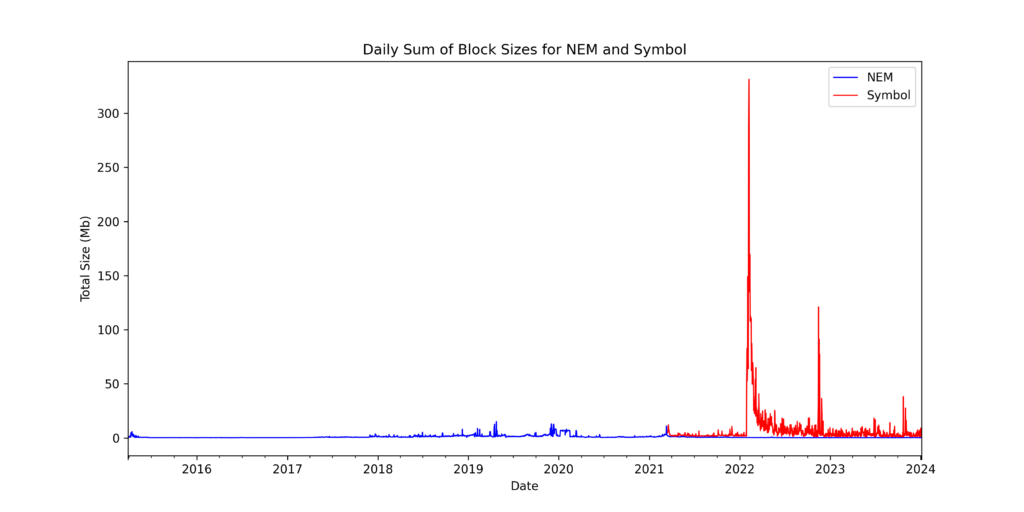
And despite a six-year headstart, Symbol is already significantly larger than NEM.
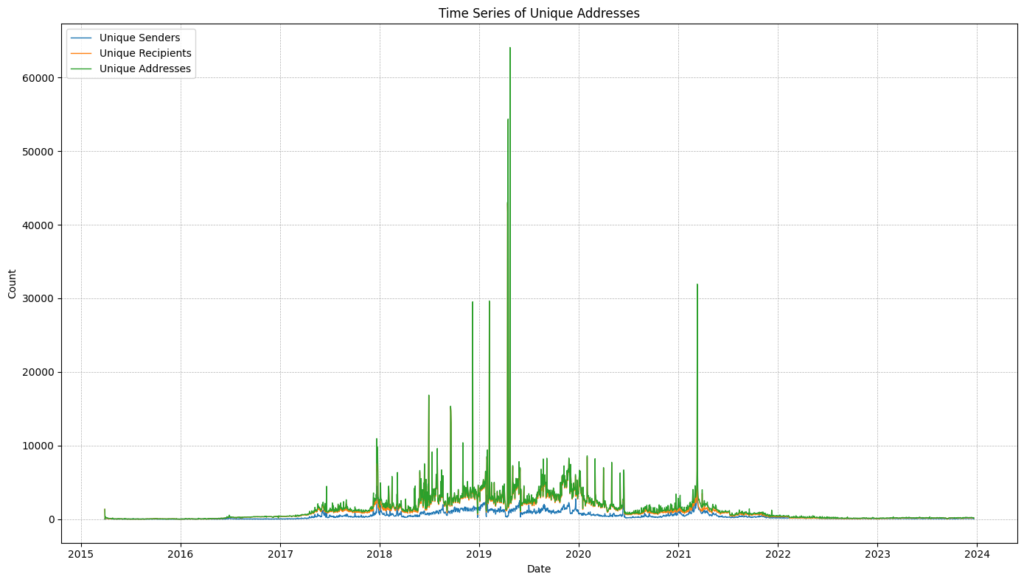
NEM unique daily transacting addresses
Below is a plot of daily unique addresses transacting on the NEM blockchain since the genesis block. As you can see the number of active NEM users has dropped since Symbol was launched and the network had a total of 1,905 unique active users across the month of November 2023.
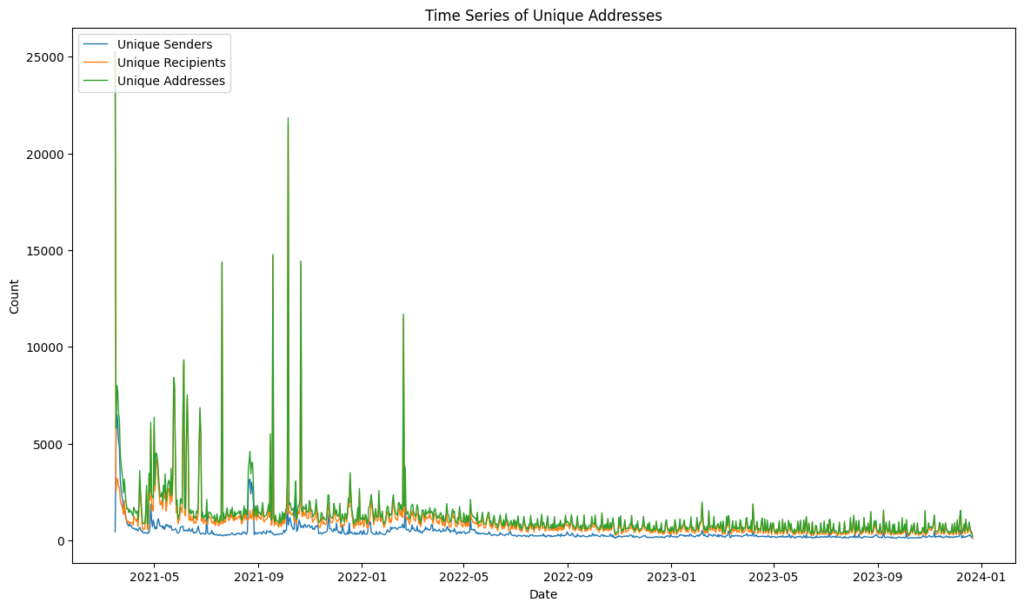
Symbol unique daily transacting addresses
Symbol usage appears to have remained relatively constant during 2023 and had 7,129 unique transacting addresses in November 2023.
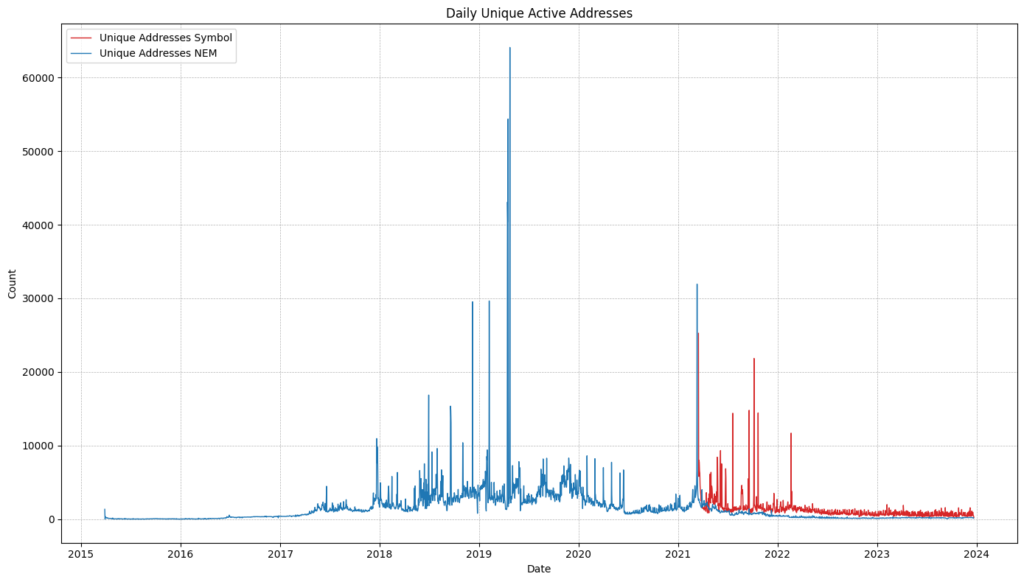
NEM vs Symbol: unique daily transacting addresses
As you can Symbol has surpassed the number of daily active users than NEM since its launch.
Harvesting
I have called the total harvesting balance Total Value Locked (TVL) to make it easy for those who are used to looking at these stats for other chains, but of course, we know that funds are never locked on NEM and Symbol. In order to generate these stats I have calculated the historical balances of all accounts on the first block of each day for both Symbol and NEM. For each day I have gone back to find all accounts that have harvested a block in the previous 2-week period and classified these as active harvesting accounts. I then sum the balance of active accounts on each day and calculate the percentage of total XEM (8,999,999,999) and XYM (circulating supply calculated based on inflation) involved in harvesting on any given date since their genesis blocks.
NEM harvesting stats – % TVL
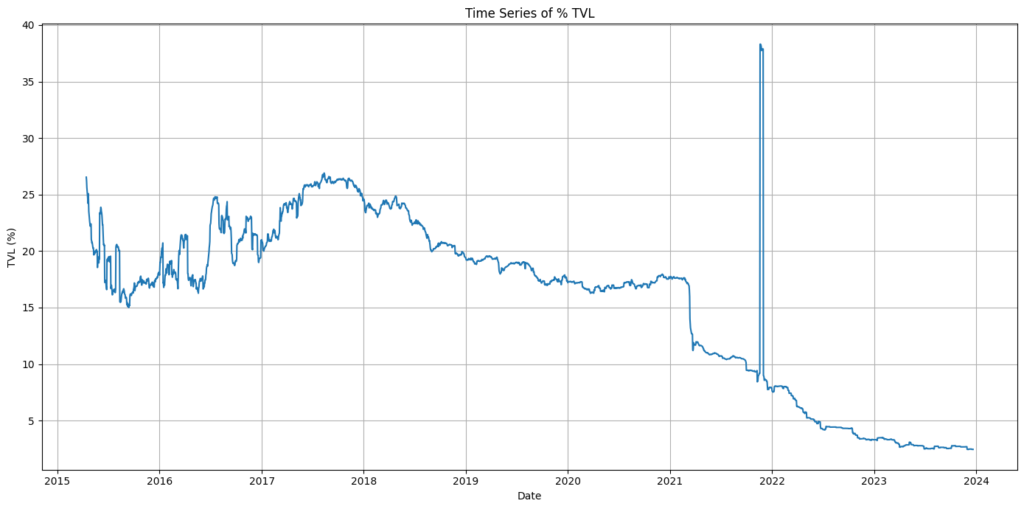
The plot below represents the % of the total XEM supply that is involved in harvesting blocks, Percentage TVL has steadily been reducing since it peaked around the Harlock hard fork on November 18th 2021 although seems to have plateaued somewhat in 2023. The take-home message here is that if you own more than 10,000 XEM, as many of you do, then you should be harvesting! You can delegate your harvesting to a node and whilst it won’t make you rich, it is money for nothing when you harvest block fees and you will be helping to secure what currently looks like a pretty weak network 😬
Symbol harvesting stats – % TVL
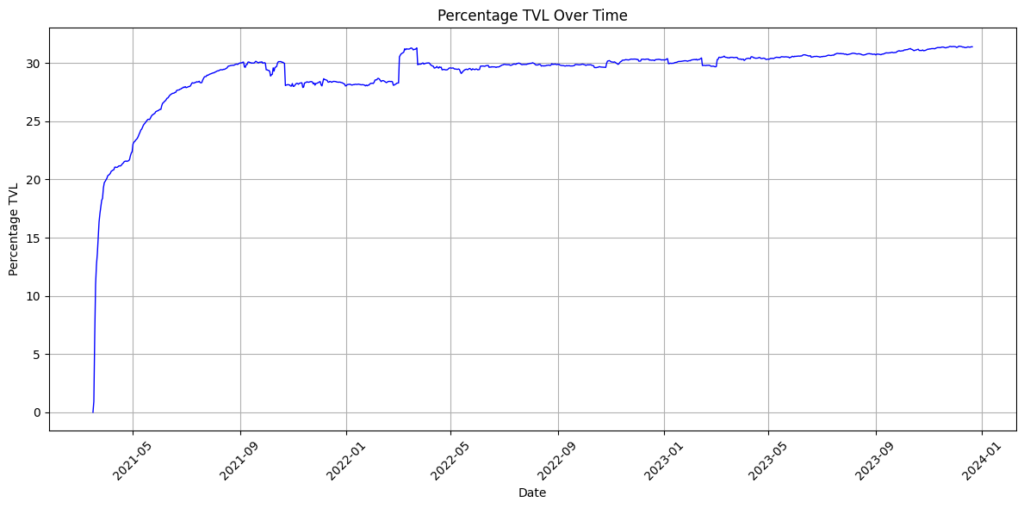
Unlike NEM the % TVL on Symbol has been steadily increasing in 2023 with over a third of all XYM partaking in harvesting. This is good to see and obviously, many exchange accounts and the treasury will hold significant sums of XYM that are not actively harvesting so the true %TVL amongst holders will be much higher.
NEM vs Symbol: % TVL
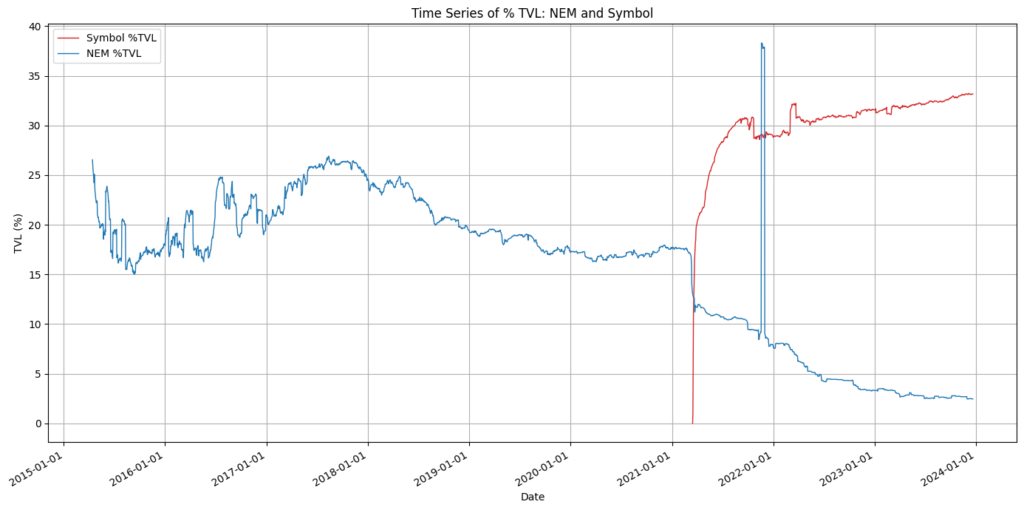
This chart again speaks for itself and demonstrates that Symbol is actively being held and used to generate income. NEM does not provide block rewards and only block transaction fees can be harvested. With the number of transactions on the NEM chain and the fees charged for sending transactions being so low, it looks like most holders are not incentivised to delegate or harvest on their own node.
Summary
So that’s my advent calendar article for 2023. It may be a lot shorter than previous posts but generating daily TVL stats was a pain I can tell you 😁 I may go back and add some more plots and code in the future and hopefully will be able to publish another article based on my XYMPOSIUM talk in the new year. Until then, have a wonderful Christmas and a happy New Year! 🥳
Methods
NEM
Shut down my NEM node and copied the database (nis5_mainnet.mv.db) to my local machine. H2 Client was used to connect to and query the database:
jdbc:h2:/Users/****/Symbol/NEM_stats/nis5_mainnetRan query to retrieve transactions and modify timestamp to genesis block as per CryptoBeliever’s article (and add tx fees):
CALL CSVWRITE('./result_export.csv', '
SELECT
    block.timestamp + 1427587585 AS timestamp,
    block.height,
    tran.transferhash AS hash,
    tran.fee AS fee,
    multisig.transferhash AS multisig_hash,
    sender.printablekey AS sender,
    recipient.printablekey AS recipient,
    CASE WHEN tranmosaics_xem.quantity IS NULL AND tranmosaics_other.quantity IS NULL THEN CAST(tran.amount/1000000.0 AS numeric(20,6))
            WHEN tranmosaics_other.quantity IS NULL THEN CAST(tranmosaics_xem.quantity/1000000.0 * tran.amount/1000000.0 AS numeric(20,6))
            ELSE 0.000000
   END AS xem_amount,
   tran.messagetype,
   tran.messagepayload
FROM transfers tran
LEFT JOIN accounts sender ON tran.senderid = sender.id
LEFT JOIN accounts recipient ON tran.recipientid = recipient.id
LEFT JOIN blocks block ON tran.blockid = block.id
LEFT JOIN multisigtransactions multisig ON tran.id = multisig.transferid
LEFT JOIN transferredmosaics tranmosaics_xem ON tran.id = tranmosaics_xem.transferid AND tranmosaics_xem.dbmosaicid = 0
LEFT JOIN transferredmosaics tranmosaics_other ON tran.id = tranmosaics_other.transferid AND tranmosaics_other.dbmosaicid != 0;
');
Saved data to a CSV file with the following format:
TIMESTAMP","HEIGHT","HASH","FEE","MULTISIG_HASH","SENDER","RECIPIENT","XEM_AMOUNT","MESSAGETYPE","MESSAGEPAYLOAD"
"1427587585","1","e90e98614c7598fbfa4db5411db1b331d157c2f86b558fb7c943d013ed9f71cb","0",,"NANEMOABLAGR72AZ2RV3V4ZHDCXW25XQ73O7OBT5","NBT3WHA2YXG2IR4PWKFFMO772JWOITTD2V4PECSB","5175000.000000","1","476f6f64206c75636b21"
Imported data into a Jupyter Notebook (Python) and interrogated data using Pandas. Timestamps were first parsed and converted to dates.
import pandas as pd
df = pd.read_csv("./output.csv", parse_dates = ["TIMESTAMP"])
df["TIMESTAMP"] = pd.to_numeric(df["TIMESTAMP"])
df["TIME"] = pd.to_datetime(df["TIMESTAMP"], unit = "s", origin='unix')
Plot daily transactions:
df['TIME'] = pd.to_datetime(df['TIME'])

# Group by date and count the number of transactions
daily_transaction_counts = df.groupby(df['TIME'].dt.date).size().reset_index(name='TransactionCount')

# Convert 'Date' to datetime for plotting
daily_transaction_counts['TIME'] = pd.to_datetime(daily_transaction_counts['TIME'])

# Create the plot
plt.figure(figsize=(12, 6))
plt.plot(daily_transaction_counts['TIME'], daily_transaction_counts['TransactionCount'], linewidth=1)
plt.title('Total Transactions Per Day')
plt.xlabel('Date')
plt.ylabel('Number of Transactions')
plt.grid(True)
plt.xticks(rotation=45)  # Rotate the x-axis labels for readability
plt.tight_layout()
plt.show()
For daily unique transacting addresses:
# Daily stats

# Convert 'TIME' column to datetime format
df['TIME'] = pd.to_datetime(df['TIME'])

# Extract date from 'TIME' column
df['DATE'] = df['TIME'].dt.date

# Group by the extracted date and count unique values in the 'SENDER' and 'RECIPIENT' columns
unique_senders = df.groupby('DATE')['SENDER'].nunique()
unique_recipients = df.groupby('DATE')['RECIPIENT'].nunique()

# Combine the unique values from 'SENDER' and 'RECIPIENT' columns for each date
unique_addresses = df.groupby('DATE').apply(lambda x: len(set(x['SENDER']).union(set(x['RECIPIENT']))))

# Construct the final DataFrame
result = pd.concat([unique_senders, unique_recipients, unique_addresses], axis=1)
result.columns = ['Unique Senders', 'Unique Recipients', 'Unique Addresses']
result.reset_index(inplace=True)
Plot:
import matplotlib.pyplot as plt

plt.figure(figsize=(14, 8))

plt.plot(result['DATE'], result['Unique Senders'], label='Unique Senders', linewidth=1)
plt.plot(result['DATE'], result['Unique Recipients'], label='Unique Recipients', linewidth=1)
plt.plot(result['DATE'], result['Unique Addresses'], label='Unique Addresses', linewidth=1)

plt.title('Time Series of Unique Addresses')
plt.xlabel('Date')
plt.ylabel('Count')
plt.legend(loc='upper left')
plt.grid(True, which='both', linestyle='--', linewidth=0.5)
plt.tight_layout()
plt.show()
NEM TVL
SQL query to get harvesting information.
CALL CSVWRITE('./NEM_blocks.txt',
'SELECT
    B.ID,
    B.HARVESTERID,
    B.HARVESTEDINNAME,
    B.TOTALFEE,
    COALESCE(A1.PRINTABLEKEY, A2.PRINTABLEKEY) AS PRINTABLEKEY
FROM
    BLOCKS B
LEFT JOIN
    ACCOUNTS A1 ON B.HARVESTEDINNAME = A1.ID
LEFT JOIN
    ACCOUNTS A2 ON B.HARVESTERID = A2.ID'
)
Get the first block of each day:
# Group by date and find the minimum 'HEIGHT' for each day
first_block_each_day = df.groupby(df['TIME'].dt.date)['HEIGHT'].min().values
Read in harvesting information from SQL query above:
harvest = pd.read_csv("./NEM_blocks.txt")Compute historical balances for each day since the genesis block:
def compute_daily_balances(df, harvesting_df, first_block_each_day):
    # Initialise a dictionary to hold the current balance of each address
    current_balances = defaultdict(float)
    daily_balances_updated = defaultdict(dict)

    # Create a dictionary for easy lookup of harvesting income for a given block height
    harvesting_income = dict(zip(harvesting_df['ID'], zip(harvesting_df['PRINTABLEKEY'], harvesting_df['TOTALFEE'])))

    # Set to keep track of blocks for which we have already added the harvesting income
    processed_blocks_for_harvesting = set()

    # Wrap the DataFrame iteration with tqdm for a progress bar
    for _, row in tqdm(df.iterrows(), total=df.shape[0], desc="Processing rows"):
        # Update the current balances for the sender and recipient
        if row['SENDER'] != 'NaN':
            current_balances[row['SENDER']] -= (row['XEM_AMOUNT'] + (row['FEE']/1000000))
        current_balances[row['RECIPIENT']] += row['XEM_AMOUNT']

        # Add the harvesting income (if any) for the current block height
        if row['HEIGHT'] in harvesting_income and row['HEIGHT'] not in processed_blocks_for_harvesting:
            harvester, fee = harvesting_income[row['HEIGHT']]
            current_balances[harvester] += fee / 1000000  # Convert fee to XEM from microXEM
            processed_blocks_for_harvesting.add(row['HEIGHT'])  # Mark this block as processed for harvesting

        # If this block height is the first block of a day, store the current balances
        if row['HEIGHT'] in first_block_each_day:
            daily_balances_updated[row['HEIGHT']] = dict(current_balances)

    return daily_balances_updated

# Execute the function
df_sorted = df.sort_values(by='HEIGHT')
daily_balances = compute_daily_balances(df_sorted, harvest, first_block_each_day)
Find all harvesting accounts in the previous two-week period from each date and sum the balances of those accounts:
def get_harvesting_addresses_for_block(harvesting_df, block_height):
    """Return addresses that have harvested in the 20159 blocks (~2 weeks) preceding the given block height."""
    # Define the range of block heights
    start_height = block_height - 20159
    end_height = block_height

    # Filter the harvesting dataframe to get addresses within this range
    harvested_addresses = harvest[(harvest['ID'] >= start_height) &
                                        (harvest['ID'] <= end_height)]['PRINTABLEKEY'].unique()

    # Count the number of unique addresses
    number_of_addresses = len(harvested_addresses)

    return harvested_addresses, number_of_addresses

# For each first block of the day, get the sum of balances of harvesting addresses
daily_harvesting_sums = {}
block_to_date_mapping = dict(zip(df_sorted['HEIGHT'], df_sorted['TIME'].dt.date))

for block_height in tqdm(first_block_each_day, desc="Processing daily blocks"):
    # Get addresses that harvested within the range for the current block
    harvested_addresses, address_count = get_harvesting_addresses_for_block(harvest, block_height)

    # Sum the balances of these addresses for the current block
    total_balance = sum(daily_balances[block_height].get(address, 0) for address in harvested_addresses)

    # Store the result
    daily_harvesting_sums[block_height] = {'TotalBalance': total_balance, 'AddressCount': address_count}

# Convert the results to a DataFrame
result_df = pd.DataFrame.from_dict(daily_harvesting_sums, orient='index').reset_index()
result_df.rename(columns={'index': 'Date'}, inplace=True)
result_df['Date'] = result_df['Date'].map(block_to_date_mapping)
Calculate % TVL (fixed supply of 8,999,999,999 XEM).
result_df['Date'] = pd.to_datetime(result_df['Date'])
# Sort the DataFrame by date
result_df = result_df.sort_values(by='Date')
# Calculate the percentage
result_df['TotalBalancePercent'] = (result_df['TotalBalance'] / 8999999999) * 100
Plot:
import matplotlib.pyplot as plt

# Calculate the percentage
result_df['TotalBalancePercent'] = (result_df['TotalBalance'] / 8999999999) * 100

# Filter out rows with negative values
result_df = result_df[result_df['TotalBalancePercent'] >= 0]

# Plotting
plt.figure(figsize=(14,7))
plt.plot(result_df['Date'], result_df['TotalBalancePercent'])
plt.title('Time Series of % TVL')
plt.xlabel('Date')
plt.ylabel('TVL (%)')
plt.grid(True)
plt.tight_layout()
plt.show()
Symbol
All data are pulled directly from mongoDB.
from pymongo import MongoClient
import base64
from sshtunnel import SSHTunnelForwarder
import pandas as pd
import matplotlib.pyplot as plt
import matplotlib.dates as mdates
from binascii import hexlify, unhexlify
import base64
from symbolchain.facade.SymbolFacade import SymbolFacade
from symbolchain.CryptoTypes import PublicKey
from collections import defaultdict
MONGO_HOST = "symbolblog-testnet.com" # Change to your own API/dual node
server = SSHTunnelForwarder(
(MONGO_HOST,22),
ssh_username='****',
ssh_password='****',
remote_bind_address=('172.20.0.2', 27017)
)
server.start()
client = MongoClient('localhost', server.local_bind_port)
print(server.local_bind_port)
print("connected")Get block data:
db = client['catapult']
collection = db.blocks
blocks = collection.find()
f = open('transactions_over_time.tsv', 'w', encoding="utf-8")
f.write("Block\tTimestamp\tTransactions\tFee\tSize\n")

for x in blocks:
    txs = x['meta']['totalTransactionsCount']
    block = x['block']['height']
    size = x['block']['size']
    timestamp = x['block']['timestamp']
    fee = x['meta']['totalFee']
    f.write("{0}\t{1}\t{2}\t{3}\t{4}\n".format(block, timestamp, txs, fee, size))
f.close()
Read in data and process:
df = pd.read_csv("./result_export.csv", parse_dates = ["TIMESTAMP"])
df["TIMESTAMP"] = pd.to_numeric(df["TIMESTAMP"])
df["TIME"] = pd.to_datetime(df["TIMESTAMP"], unit = "s", origin='unix')
Make total daily transactions plot:
df['TIME'] = pd.to_datetime(df['TIME'])

# Group by date and count the number of transactions
daily_transaction_counts = df.groupby(df['TIME'].dt.date).size().reset_index(name='TransactionCount')

# Convert 'Date' to datetime for plotting
daily_transaction_counts['TIME'] = pd.to_datetime(daily_transaction_counts['TIME'])

# Create the plot
plt.figure(figsize=(12, 6))
plt.plot(daily_transaction_counts['TIME'], daily_transaction_counts['TransactionCount'], linewidth=1)
plt.title('Total Transactions Per Day')
plt.xlabel('Date')
plt.ylabel('Number of Transactions')
plt.grid(True)
plt.xticks(rotation=45)  # Rotate the x-axis labels for readability
plt.tight_layout()
plt.show()
Get daily unique transactions:
from pymongo import MongoClient
import base64
from sshtunnel import SSHTunnelForwarder
import pandas as pd
import matplotlib.pyplot as plt
import matplotlib.dates as mdates
import calmap
from binascii import hexlify, unhexlify
import base64
from symbolchain.facade.SymbolFacade import SymbolFacade
from symbolchain.CryptoTypes import PublicKey

MONGO_HOST = "symbolblog-testnet.com" # Change server and user/pass

server = SSHTunnelForwarder(
    (MONGO_HOST,22),
    ssh_username='*******',
    ssh_password='*******',
    remote_bind_address=('172.20.0.2', 27017)
  )
server.start()


client = MongoClient('localhost', server.local_bind_port)
print(server.local_bind_port)
print("connected")
print(client)

# Get all blocks for height to date mapping

db = client['catapult']
collection = db.blocks
blocks = collection.find()
f = open('transactions_over_time.tsv', 'w', encoding="utf-8")
f.write("Block\tTimestamp\tTransactions\tFee\n")

for x in blocks:
    txs = x['meta']['totalTransactionsCount']
    block = x['block']['height']
    timestamp = x['block']['timestamp']
    fee = x['meta']['totalFee']
    f.write("{0}\t{1}\t{2}\t{3}\n".format(block, timestamp, txs, fee))
f.close()

# Read in and calculate the datetime value from timestamp
df = pd.read_csv("transactions_over_time.tsv", sep='\t', parse_dates = ["Timestamp"])
df["Timestamp"] = pd.to_numeric(df["Timestamp"])
df["Timestamp"] = df["Timestamp"] + 1615853185000
df["Time"] = pd.to_datetime(df["Timestamp"], unit = "ms")


# Get all transactions (height, sender, recipient)
facade = SymbolFacade('mainnet')

db = client['catapult']
collection = db.transactions
txs = collection.find()

f = open('txs.tsv', 'w', encoding="utf-8")
f.write("Height\tSender\tRecipient\n")


for x in txs:
    height = x['meta']['height']
    sender = str(facade.network.public_key_to_address(PublicKey((hexlify(x['transaction']['signerPublicKey']).decode('utf8')))))

    if 'recipientAddress' in x['transaction']:
        recipient = base64.b32encode((bytes(x['transaction']['recipientAddress']))).decode('utf8')[0:39]
    else:
        recipient = "None"  # placeholder value

    f.write("{0}\t{1}\t{2}\n".format(height, sender, recipient))
f.close()

df2 = pd.read_csv("txs.tsv", sep='\t')

# First download all time price data from coinmarketcap then read in the CSV

prices = pd.read_csv("XYM_ALL_graph_coinmarketcap.csv", sep=';')
prices['timestamp'] = pd.to_datetime(prices['timestamp']).apply(lambda x: x.strftime('%Y-%m'))


df['YearMonth'] = df['Time'].dt.to_period('M')
monthly_transactions = df.groupby('YearMonth')['Transactions'].sum()

# Total Unique Addresses Transacting in a Given Month:
merged_df = pd.merge(df, df2, left_on='Block', right_on='Height', how='inner')
unique_addresses = merged_df.groupby('YearMonth').apply(lambda x: len(set(x['Sender'].tolist() + x['Recipient'].dropna().tolist())))

# Total Unique Senders in a Given Month:
unique_senders = merged_df.groupby('YearMonth')['Sender'].nunique()

# Total Unique Recipients in a Given Month:
unique_recipients = merged_df.groupby('YearMonth')['Recipient'].nunique()

# Combine results
result = pd.concat([monthly_transactions, unique_addresses, unique_senders, unique_recipients], axis=1)
result.columns = ['Monthly Transactions', 'Unique Addresses', 'Unique Senders', 'Unique Recipients']
prices['timestamp'] = prices['timestamp'].astype('period[M]')
prices = prices.groupby('timestamp').mean()

result = result.merge(prices, left_index=True, right_on='timestamp', how='left')
result.rename(columns={'timestamp': 'Date'}, inplace=True)
result = result.reset_index(drop=True)

result.to_csv("results.tsv", sep='\t')


# Daily stats:

df = pd.read_csv("transactions_over_time.tsv", sep='\t', parse_dates = ["Timestamp"])
df["Timestamp"] = pd.to_numeric(df["Timestamp"])
df["Timestamp"] = df["Timestamp"] + 1615853185000
df["Time"] = pd.to_datetime(df["Timestamp"], unit = "ms")

# Merging the two dataframes on block height
merged_df = pd.merge(df2, df[['Block', 'Time']], left_on='Height', right_on='Block', how='left')

# Convert 'Time' column to datetime format
merged_df['Time'] = pd.to_datetime(merged_df['Time'])

# Extract date from 'Time' column
merged_df['Date'] = merged_df['Time'].dt.date

# Group by the extracted date and count unique values in the 'Sender' and 'Recipient' columns
unique_senders = merged_df.groupby('Date')['Sender'].nunique()
unique_recipients = merged_df.groupby('Date')['Recipient'].nunique()

# Combine the unique values from 'Sender' and 'Recipient' columns for each date
unique_addresses = merged_df.groupby('Date').apply(lambda x: len(set(x['Sender']).union(set(x['Recipient']))))

# Construct the final DataFrame
result = pd.concat([unique_senders, unique_recipients, unique_addresses], axis=1)
result.columns = ['Unique Senders', 'Unique Recipients', 'Unique Addresses']
result.reset_index(inplace=True)

result.to_csv("results_unique_symbol.tsv", sep='\t')
Make the plot:
plt.figure(figsize=(14, 8))

# Plotting with thinner lines
plt.plot(result['Date'], result['Unique Senders'], label='Unique Senders', linewidth=1)
plt.plot(result['Date'], result['Unique Recipients'], label='Unique Recipients', linewidth=1)
plt.plot(result['Date'], result['Unique Addresses'], label='Unique Addresses', linewidth=1)

plt.title('Time Series of Unique Addresses')
plt.xlabel('Date')
plt.ylabel('Count')
plt.legend(loc='upper left')
Symbol TVL
Get account key links:
db = client['catapult']
collection = db.transactions
facade = SymbolFacade('mainnet')
mapping = defaultdict(dict)

out = collection.find({'transaction.type': 16716})

for x in out:
    if x['transaction']['linkAction'] == 1:
        height = x['meta']['height']
        main = str(facade.network.public_key_to_address(PublicKey((hexlify(x['transaction']['signerPublicKey']).decode('utf8')))))
        link = str(facade.network.public_key_to_address(PublicKey((hexlify(x['transaction']['linkedPublicKey']).decode('utf8')))))
        # Ergh - some link accounts are used by more than one main account at different blocks :(
        # Need to include height :(
        # Shame on these accounts! :D
        mapping[link][height]=main
Download the list of block rewards from here:
Reformatted slightly and stored as a dataframe:
df_reward = pd.read_csv("../block_rewards.tsv", sep='\t')
df_reward.head()
Get all block rewards by iterating through the blocks collection:
facade = SymbolFacade('mainnet')

db = client['catapult']
collection = db.blocks
blocks = collection.find()

historic_fees = defaultdict(dict)

harvest_sinkV1 = "NBUTOBVT5JQDCV6UEPCPFHWWOAOPOCLA5AY5FLI"
sink = "NAVORTEX3IPBAUWQBBI3I3BDIOS4AVHPZLCFC7Y"
fork_height = 689761

f = open('block_data.tsv', 'w', encoding="utf-8")
f.write("Block\tTimestamp\tTotalFee\tFeeMultiplier\tHarvester\tBeneficiary\tReward\n")

i = 0
j = 0

for x in blocks:
    height = int(x['block']['height'])
    multiplier = x['block']['feeMultiplier']
    fee = x['meta']['totalFee']/1000000
    timestamp = x['block']['timestamp']
    h = str(facade.network.public_key_to_address(PublicKey((hexlify(x['block']['signerPublicKey']).decode('utf8')))))

    # This is a hassle.. There are linked accounts associated with multiple main accounts 🙄
    if not mapping[h]:
        harvester = h
    else:
        for keys in mapping[h]:
            if keys <= height:
                harv = mapping[h][keys]
        harvester = harv

    beneficiary = str(base64.b32encode((bytes(x['block']['beneficiaryAddress']))).decode('utf8')[0:39])

    # Eek - some node fee beneficiaries are sending funds to their linked address :/
    # Probably should use the same logic as above to avoid nasty surprises

    if not mapping[beneficiary]:
        beneficiary = beneficiary
    else:
        for keys in mapping[beneficiary]:
            if keys <= height:
                b = mapping[beneficiary][keys]
        beneficiary = b

    reward = (df_reward.iloc[df_reward[df_reward['Height'].le(height)].index[-1]]['Reward'])/1000000
    f.write("{0}\t{1}\t{2}\t{3}\t{4}\t{5}\t{6}\n".format(height, timestamp, fee, multiplier, harvester, beneficiary, reward))

    beneficiary_reward = (reward+fee) * 0.25
    harvester_reward = (reward+fee) * 0.70
    sink_reward = (reward+fee) * 0.05

    # Harvesting and benefificary income
    historic_fees[harvester][height]=harvester_reward

    if height >= fork_height:
        try:
            historic_fees[sink][height] += sink_reward
        except:
            historic_fees[sink][height] = sink_reward
    else:
        try:
            historic_fees[harvest_sinkV1][height] += sink_reward
        except:
            historic_fees[harvest_sinkV1][height] = sink_reward

    try:
        historic_fees[beneficiary][height] += beneficiary_reward
    except:
        historic_fees[beneficiary][height] = beneficiary_reward

    if (j == 100000):
        print("{0} blocks processed".format(i))
        j = 0
    i+=1
    j+=1

f.close()
Save data and get last block processed from the query above:
import json
with open("historic_fees.json", "w") as outfile:
    json.dump(historic_fees, outfile)

df_block_data = pd.read_csv("block_data.tsv", sep='\t')
end = int(df_block_data['Block'].iloc[-1])
Convert timestamps and get the first block of each day:
df_block_data["Timestamp"] = df_block_data["Timestamp"] + 1615853185000
df_block_data["Time"] = pd.to_datetime(df_block_data["Timestamp"], unit = "ms")

# First block of each day
first_block_each_day = df_block_data.groupby(df_block_data['Time'].dt.date)['Block'].min().values
Create a dictionary of fee multiplier mappings to block and make an array of multipliers:
multiplier_mapping = dict(zip(df_block_data.Block, df_block_data.FeeMultiplier))
block_fee_mult = df_block_data['FeeMultiplier'].tolist()
Get account aliases:
# Get account aliases!

db = client['catapult']
collection = db.addressResolutionStatements
facade = SymbolFacade('mainnet')
aliases = defaultdict(dict)

out = collection.find()

for x in out:
    height = x['statement']['height']
    unresolved = base64.b32encode((bytes(x['statement']['unresolved']))).decode('utf8')[0:39]
    alias_address = base64.b32encode((bytes(x['statement']['unresolved']))).decode('utf8')[0:39]
    e = 0
    for entry in x['statement']['resolutionEntries']:
        resolved_address = base64.b32encode((bytes(x['statement']['resolutionEntries'][e]['resolved']))).decode('utf8')[0:39]
        aliases[alias_address][height]=resolved_address
        e+=1
Calculate historical account balances and save the result:
import statistics

facade = SymbolFacade('mainnet')
db = client['catapult']
collection = db.transactions
out = collection.find()

historic = defaultdict(dict)

f = open('all_txs_sent.tsv', 'w', encoding="utf-8")
f.write("Address\tBlock\n")

i = 0
j = 0
height = 0
slocks = 0
hash_locks = defaultdict(dict)
secret_locks = defaultdict(dict)

sink = "NCVORTEX4XD5IQASZQEHDWUXT33XBOTBMKFDCLI"
mosaic_sinkV1 = "NC733XE7DF46Q7QYLIIZBBSCJN2BEEP5FQ6PAYA"
namespace_sinkV1 = "NBDTBUD6R32ZYJWDEWLJM4YMOX3OOILHGDUMTSA"
fork_height = 689761

historic["NASYMBOLLK6FSL7GSEMQEAWN7VW55ZSZU25TBOA"][1] = 7842928625

# Get average FeeMultiplier from last 60 blocks

def feeMultiplier(block_height):
    block_height-=1
    block_height_start = block_height-60
    fee_multiplier = block_fee_mult[block_height_start:block_height]
    fee_multiplier = [100 if item == 0 else item for item in fee_multiplier]
    average = statistics.median(fee_multiplier)
    return(average)

same_logic = [16716, 16972, 16705, 16707, 16963, 16708, 16964, 17220, 16973, 16725, 16974, 17230, 16720, 16976, 17232, 16977, 16721]

for x in out:
    fee = 0
    height = int(x['meta']['height'])

    if (height >= end):
        break

    sender = str(facade.network.public_key_to_address(PublicKey((hexlify(x['transaction']['signerPublicKey']).decode('utf8')))))
    tx_type = int(x['transaction']['type'])
    multiplier = multiplier_mapping[height]

    f.write('{0}\t{1}\n'.format(address, height))

    try:
        size = x['transaction']['size']
        fee = (size * multiplier)/1000000
        try:
            historic[sender][height] += -abs(fee)
        except:
            historic[sender][height] = -abs(fee)
    except:
        pass

    if tx_type in same_logic:
        pass

    elif tx_type == 16961: # Aggregate bonded transaction
        hash_id = hexlify(x['meta']['hash']).decode('utf8')
        if hash_id in hash_locks:
            initiator = hash_locks[hash_id]['sender']
            del hash_locks[hash_id]
            try:
                historic[initiator][height] += 10
            except:
                historic[initiator][height] = 10

    elif tx_type == 17229:
        # Special case - during the Cyprus fork XYM mosaics were revoked from NxL accounts
        # And redistributed to the new treasury and sink addresses

        if height == 689761:
            mosaic = x['transaction']['mosaicId']
            acc = str(base64.b32encode(x['transaction']['sourceAddress']).decode('utf8')[0:39])
            if (mosaic == 7777031834025731064):
                amount = x['transaction']['amount']/1000000
                # Add to recipient (the requester)
                try:
                    historic[sender][height] += amount
                except:
                    historic[sender][height] = amount

                # Remove from sender
                try:
                    historic[acc][height] += -abs(amount)
                except:
                    historic[acc][height] = -abs(amount)

    elif tx_type == 16712: #HASH_LOCK
        try:
            duration = x['transaction']['duration']
            lock_end = height + duration
            lock_hash = hexlify(x['transaction']['hash']).decode('utf8')
            hash_locks[lock_hash]['lock_end'] = lock_end
            hash_locks[lock_hash]['sender'] = sender

            # Pay 10 XYM deposit
            try:
                historic[sender][height] += -abs(10)
            except:
                historic[sender][height] = -abs(10)
        except:
            pass

    elif tx_type == 16722: #SECRET_LOCK

        if x['transaction']['mosaicId'] == 7777031834025731064:
            amount = x['transaction']['amount']/1000000
            recipient = str(base64.b32encode(x['transaction']['recipientAddress']).decode('utf8')[0:39])
            secret = hexlify(x['transaction']['secret']).decode('utf8')
            secret_duration = x['transaction']['duration']
            expiry = secret_duration + height
            secret_locks[slocks]['recipient'] = recipient
            secret_locks[slocks]['sender'] = sender
            secret_locks[slocks]['amount'] = amount
            secret_locks[slocks]['secret'] = secret
            secret_locks[slocks]['expiry'] = expiry
            secret_locks[slocks]['lock_height'] = height
            slocks+=1
            try:
                historic[sender][height] += -abs(amount)
            except:
                historic[sender][height] = -abs(amount)


    elif tx_type == 16978: #SECRET_PROOF

        recipient = str(base64.b32encode(x['transaction']['recipientAddress']).decode('utf8')[0:39])
        secret = hexlify(x['transaction']['secret']).decode('utf8')
        lock_id = ""
        for locks in secret_locks:
            lsecret = secret_locks[locks]['secret']
            lrecipient = secret_locks[locks]['recipient']
            lsender = secret_locks[locks]['sender']
            amount = secret_locks[locks]['amount']

            if ((lsecret == secret) & (lrecipient == recipient)):
                lock_id = locks
                try:
                    historic[lrecipient][height] += amount
                except:
                    historic[lrecipient][height] = amount
        try:
            del secret_locks[lock_id]
        except:
            pass

    elif tx_type == 16717: #MOSAIC_DEFINITION
        # I think should be in an aggregate so won't have tx size but I guess could be exceptions?
        if height > 1:
            average_fee_mulitplier = feeMultiplier(height)
            rental_fee = average_fee_mulitplier * 0.5
            try:
                if height >= fork_height:
                    historic[sink][height] += rental_fee
                else:
                    historic[mosaic_sinkV1][height] += rental_fee
            except:
                if height >= fork_height:
                    historic[sink][height] = rental_fee
                else:
                    historic[mosaic_sinkV1][height] = rental_fee

            try:
                historic[sender][height] += -abs(rental_fee)
            except:
                historic[sender][height] = -abs(rental_fee)


    elif tx_type == 16718: #NAMESPACE_REGISTRATION

        if height > 1:
            try:
                duration = x['transaction']['duration']
                average_fee_mulitplier = feeMultiplier(height)
                rental_fee = (average_fee_mulitplier * 2 * duration)/1000000
                try:
                    historic[sender][height] += -abs(rental_fee)
                except:
                    historic[sender][height] = -abs(rental_fee)
                try:
                    if height >= fork_height:
                        historic[sink][height] += rental_fee
                    else:
                        historic[namespace_sinkV1][height] += rental_fee
                except:
                    if height >= fork_height:
                        historic[sink][height] = rental_fee
                    else:
                        historic[namespace_sinkV1][height] = rental_fee

            except:

                average_fee_mulitplier = feeMultiplier(height)
                rental_fee = 0.1 * average_fee_mulitplier
                try:
                    historic[sender][height] += -abs(rental_fee)
                except:
                    historic[sender][height] = -abs(rental_fee)
                try:
                    if height >= fork_height:
                        historic[sink][height] += rental_fee
                    else:
                        historic[namespace_sinkV1][height] += rental_fee
                except:
                    if height >= fork_height:
                        historic[sink][height] = rental_fee
                    else:
                        historic[namespace_sinkV1][height] = rental_fee

    elif tx_type == 16724: #TRANSFER
        recipient = str(base64.b32encode(x['transaction']['recipientAddress']).decode('utf8')[0:39])

        if "AAAAAAAAAAAAAAAAA" in recipient:
        # Address is probably an alias
        # Get resolution

            try:
                recipient = aliases[recipient][height]
            except:
                recipient = recipient

        mosaics = x['transaction']['mosaics']
        for mos in mosaics:
            if ((mos['id'] == 7777031834025731064) | (mos['id'] == -1780160202445377554)):
                amount = mos['amount']/1000000
                # Add to recipient
                try:
                    historic[recipient][height] += amount
                except:
                    historic[recipient][height] = amount

                # Remove from sender
                try:
                    historic[sender][height] += -abs(amount)
                except:
                    historic[sender][height] = -abs(amount)
    else:
        print("Unknown transaction type: {0}".format(tx_type))
        break

    j+=1
    i+=1
    if (j == 100000):
        print("{0} transactions processed in {1} blocks".format(i, height))
        j = 0

for l in secret_locks:
    sender = secret_locks[l]['sender']
    amount = secret_locks[l]['amount']
    expiry = secret_locks[l]['expiry']
    lock_height = secret_locks[l]['lock_height']

    if expiry < end:
        try:
            historic[sender][lock_height] += amount
        except:
            historic[sender][lock_height] = amount

for expired in hash_locks:
    block = hash_locks[expired]['lock_end']

    if block <= end:
    # The harvester of the block where the hash lock tx failed gets the 10 XYM
        harv_address = df_block_data.loc[df_block_data['Block'] == block, 'Harvester'].iloc[0]

        if not mapping[harv_address]:
            harvester = harv_address
        else:
            harvester = mapping[harv_address]

        try:
            historic_fees[harvester][block] += 10
        except:
            historic_fees[harvester][block] = 10

f.close()

import json
with open("historic_txs.json", "w") as outfile:
    json.dump(historic, outfile)
And finally(!) calculate the daily TVL for Symbol (again harvesting accounts are defined as accounts that have harvested at least one block in the previous two weeks):
df_block_data['Timestamp'] = pd.to_datetime(df_block_data['Timestamp'], unit='ms')

# Merge the rewards from historic_fees into historic
for account, rewards in historic_fees.items():
    if account in historic:
        for block, reward in rewards.items():
            if block in historic[account]:
                historic[account][block] += reward
            else:
                historic[account][block] = reward
    else:
        historic[account] = rewards

# Create an empty list to store the results
result_data = []

# Initialize the total balance as 0
total_balance = 0.0

# Iterate through the first_block_each_day array
for day_block_height in first_block_each_day:
    # Get the corresponding date from df_block_data
    date = df_block_data[df_block_data['Block'] == day_block_height]['Timestamp'].values[0]

    # Calculate the total balance as the sum of balances of all accounts up to and including the current block height
    total_balance = sum([sum([change for block, change in balance_changes.items() if block <= day_block_height]) for balance_changes in historic.values()])

    # Extract harvesters within the block range (2 weeks)
    start_block = max(1, day_block_height - 40319)
    end_block = day_block_height
    harvesters = df_block_data[(df_block_data['Block'] >= start_block) & (df_block_data['Block'] <= end_block)]['Harvester'].unique()
    num_harvesting_accounts = len(harvesters)

    # Calculate the sum of balances for these harvesters from the historic dictionary
    combined_balance = 0.0
    for harvester in harvesters:
        if harvester in historic:
            balance_changes = historic[harvester]
            cumulative_balance = sum([change for block, change in balance_changes.items() if block <= day_block_height])
            combined_balance += cumulative_balance

    # Append the results to the list as a dictionary
    result_data.append({'Date': date, 'CombinedBalance': combined_balance, 'TotalBalance': total_balance, 'HarvestingAccounts': num_harvesting_accounts})

# Create a DataFrame from the list of dictionaries
result_df = pd.DataFrame(result_data)

# Convert dates to YYYY-MM-DD format
result_df['Date'] = result_df['Date'].dt.strftime('%Y-%m-%d')

# Calculate the %TVL (harvesting balance / total balance) * 100
result_df['TVL_Percentage'] = (result_df['CombinedBalance'] / result_df['TotalBalance']) * 100
result_df['HarvestingAccounts'] = [data['HarvestingAccounts'] for data in result_data]
I’m a Symbol and NEM enthusiast and run this blog to try to grow awareness of the platform in the English-speaking world. If you have any Symbol news you would like me to report on or you have an article that you would like to publish then please let me know!


Sorry, the comment form is closed at this time.